SSIRA Financials

How $1.485 Trillion Grows to $40 Trillion by 2040

The Model Behind the Numbers

The Social Security Investment Fund (SSIF) is powered by 13 recurring revenue streams and assumes an 8% annual return. No withdrawals are made until full solvency is reached, preserving capital for compounding growth.

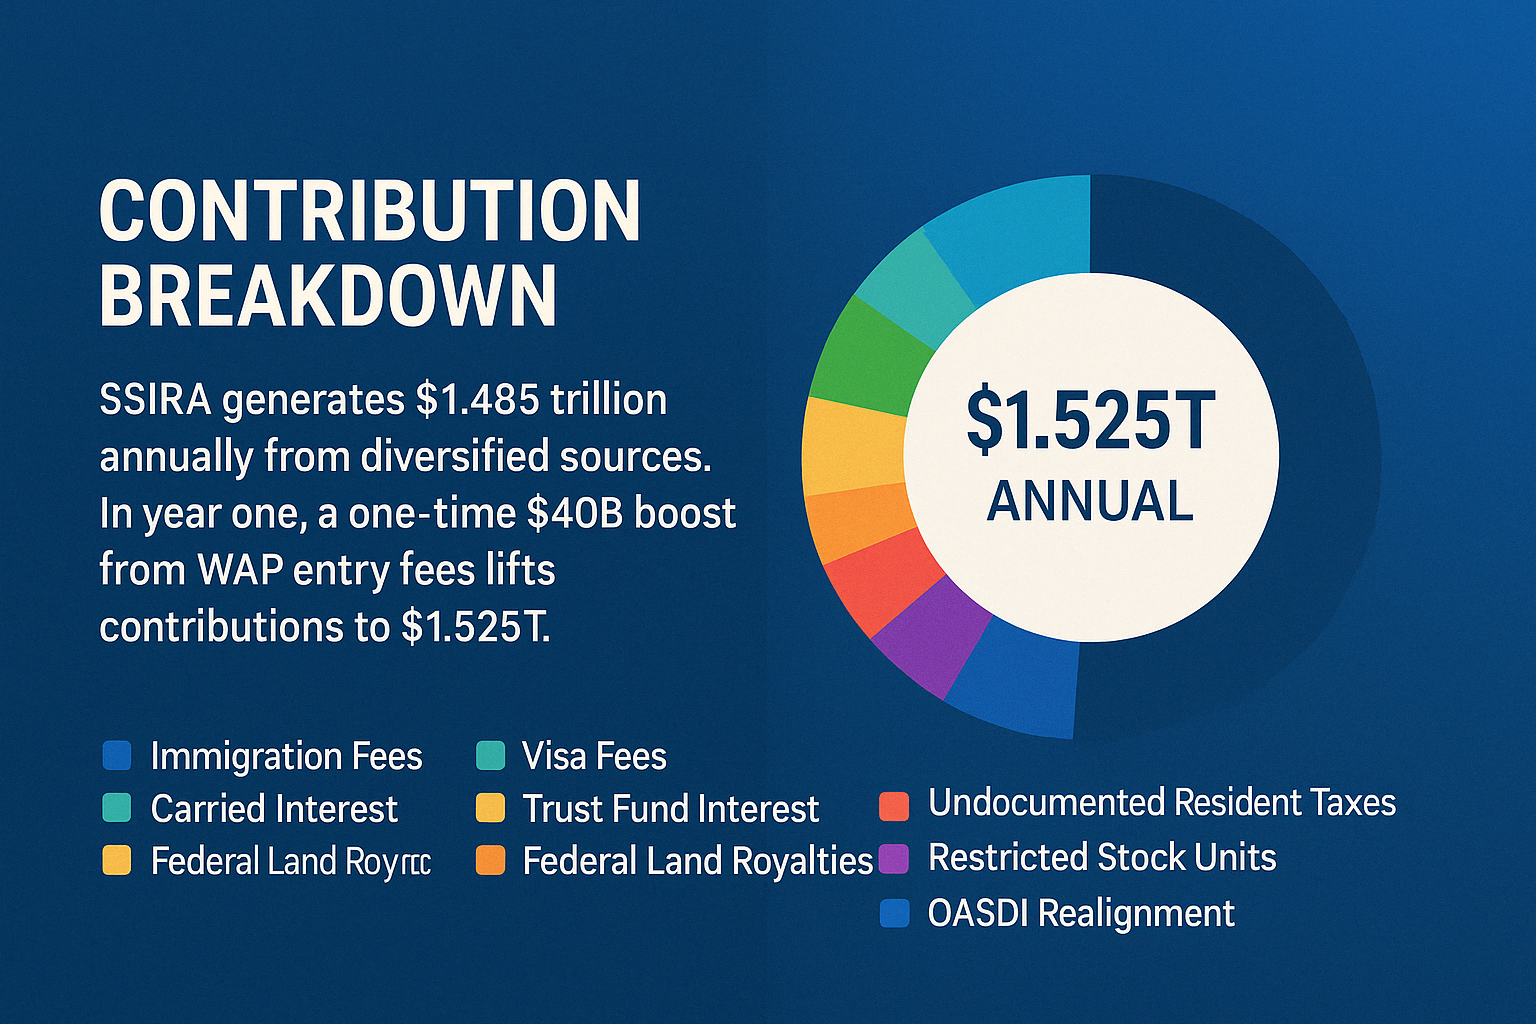
Contribution Breakdown

SSIRA generates $1.485 trillion annually from diversified sources. In year one, a one-time $40B boost from WAP entry fees lifts contributions to $1.525T.

Contribution Breakdown Chart

Return Sensitivity

Here's how the fund performs over time under different return rates:

Return Sensitivity Chart

SSIRA vs. OASDI

Unlike the old Social Security model, SSIRA becomes financially independent within 15 years and doesn’t require additional tax increases to remain solvent.

Comparison Chart

Year-by-Year Projection

YearContribution ($T)Total Fund ($T, 8%)
20261.5251.65
20271.4853.38
20281.4855.22
20291.4857.18
20301.4859.26
20311.48511.47
20321.48513.80
20331.48516.27
20341.48518.87
20351.48521.61
20361.48524.49
20371.48527.51
20381.48530.67
20391.48533.98
20401.48540.00+